Save time and improve quality to finalize or maintain a GA implementation with different checks & customized report directly in Data Studio.
The objective of this tool is to save time by having a quick overview with pre-configured reports. On multi-site environments or with a lot of properties in GA, the idea was to be able to identify & correct, precisely & quickly, tracking issues.
Summary
- Revenu discrepancy
- Duplication of transactions
- Data loss from ecommerce interactions
- Persistence of ecommerce values
When you’re doing an Analytics implementation, the data quality control step in GA is essential. This step comes to validate the end of the implementation when the data set has been fully populated and in the correct format values. It is also important to audit the quality of the data returned to GA from time to time in order to maintain consistent monitoring over the long term.
Unfortunately, this step is sometimes not prioritized because a lot of effort will have been previously concentrated on checking the data layer during an implementation project. In the majority of cases, and especially for projects with large data layers, it is almost impossible to test all the possible key/value combinations. It is therefore customary to let our users run the machine for a while before completing the check via an inventory of fixtures in GA.
This type of report can make sense for both small and large implementations, for a single environment or for controlling multiple sites/applications.
Rapport Data Studio de contrôle qualité des données E-commerce
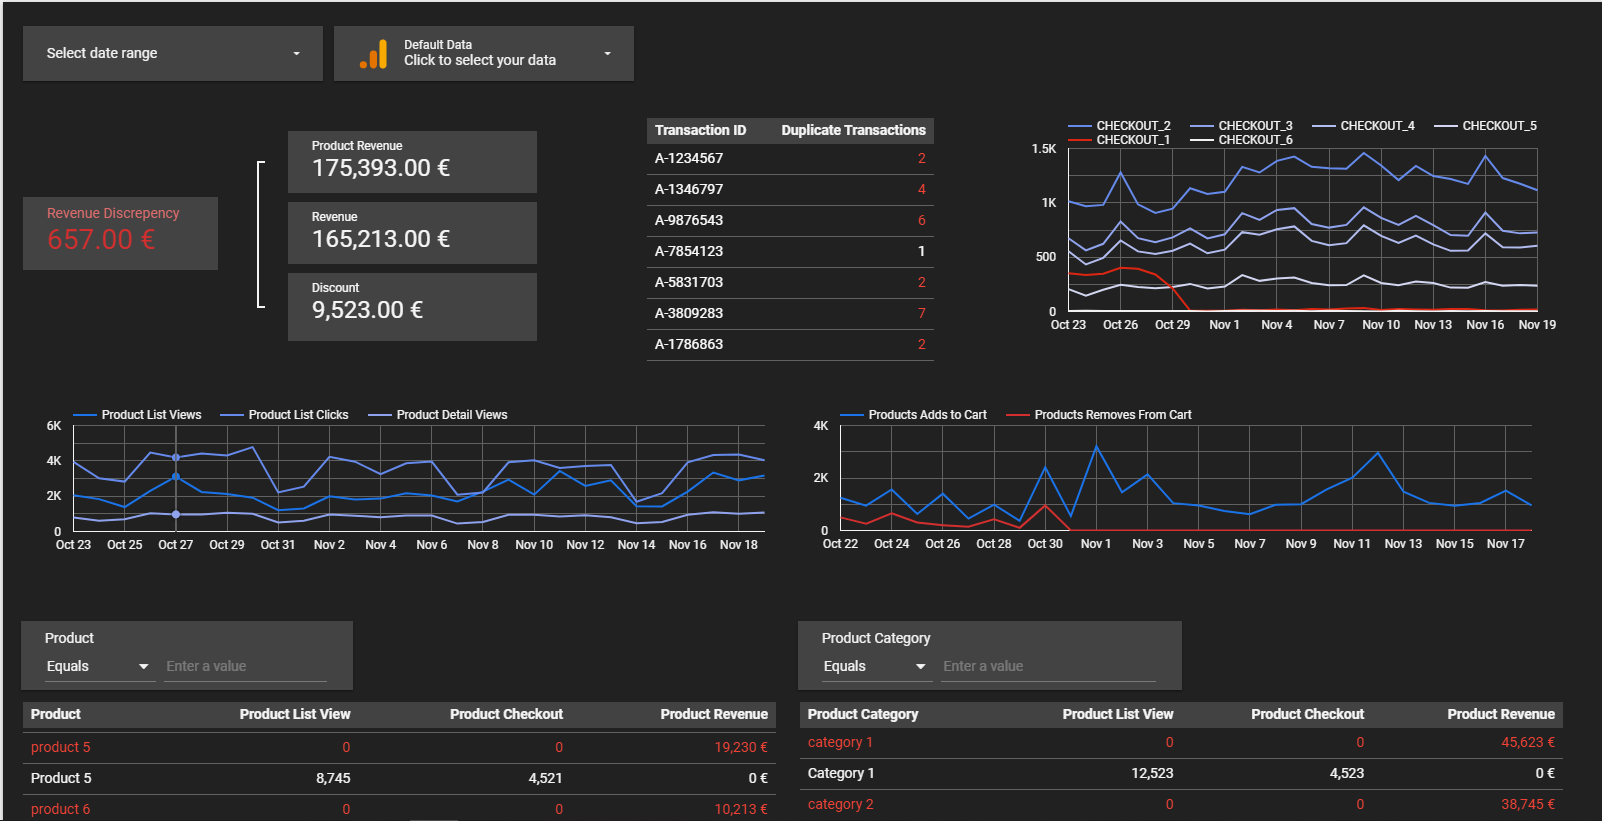
Revenue discrepancy
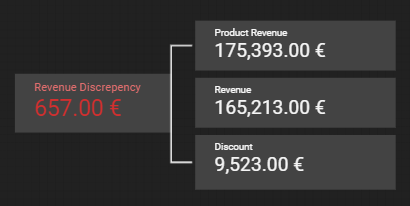
The first section of the report displays the revenues. This step can be quite variable depending on the data collection guidelines. In itself, a difference in revenue between the two does not necessarily explain a tracking or calculation problem. It may be that the price discounted at the transaction level is not being applied to the prices of the products in a transaction. This is another subject that can be explored on the InfoTrust blog.
Here the idea is to know if we have coherent data between our data-loss/sales per product & possibly the total discounts applied to orders (previously reported in GA). The calculation allows us to quickly evaluate, if we have a data-loss of the discount during an order. It often happens, for example, that the calculation of the revenue at the transaction level according to a discount is not correctly calculated. In the Data Studio Framework above, our revenue at the product level – the revenue at the transaction level must be = the total discount amount
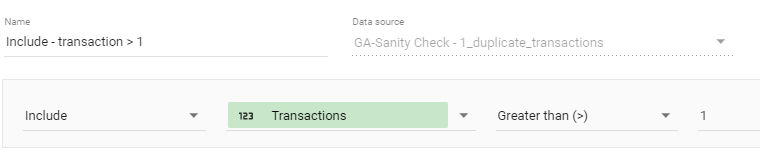
Transaction duplication
The second section of the report examines the duplication of transactions. In different cases, the same transaction may be counted twice in Google Analytics. Example: when reloading the payment confirmation page, transaction information with the same transaction ID is sent. It is often advisable to avoid this kind of situation by asking your developers not to send the same transaction information twice when reloading the confirmation page. If it is a fix that you want to settle quickly without the help of your developers, I have created a custom tag in Google Tag Manager that allows among other things to avoid duplication of transactions through the Local Storage The link of the article here. And you can access to the Local Storage Interact tag in the Google Tag Manager gallery.
Here the table is a combination of transaction identifiers in dimension + transaction in metric. I advise you to apply a filter that allows you to take the number of transactions > 1. It allows you to quickly identify if transactions are duplicated and in what proportion.
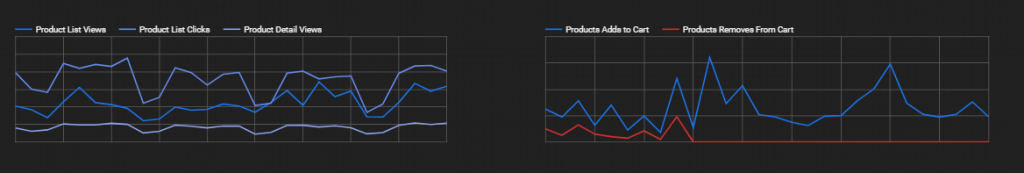
Data Loss of ecommerce interactions
The third section is dedicated to tracking ecommerce interaction events purchase/checkouts/detail views/list views/list clicks/add to & remove from cart/promotion views. The idea in this section is to get a quick view to identify the loss or slowdown of an e-commerce event to identify quickly a potential tracking issue. Example: in the screenshot of the checkout you can see that so far we are losing a lot of data on step 1 while the next steps are being collected. Same behavior for the loss of Removes From Cart below. It is possible that an event is no longer correctly sent in the Data Layer or in GTM. This visualization allows us to identify the problem quickly and move forward to a fix.
Persistence of ecommerce values
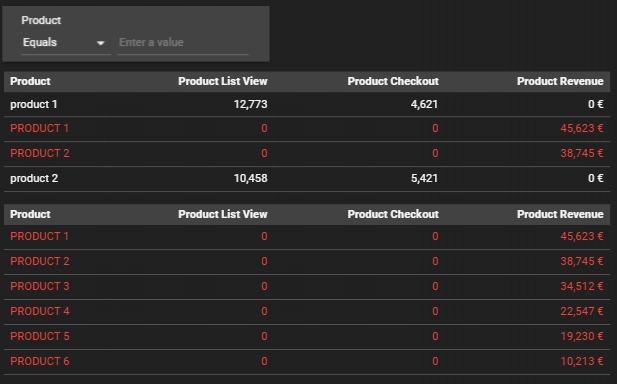
The fourth and last section looks at the persistence of e-Commerce values such as product name, product category, lists, promotions etc…
Example :
My “product 1” is seen 0 times in the checkout
But my “PRODUCT 1” is bought 15 times
These two products are the same but are separated in GA because the values are case sensitive. It is very common to encounter inconsistencies in values through different ecommerce interactions making some reports completely inconsistent. This is why it is important to give precise indications to your developers beforehand or implement solutions to reduce the risks of discrepancies through GTM.
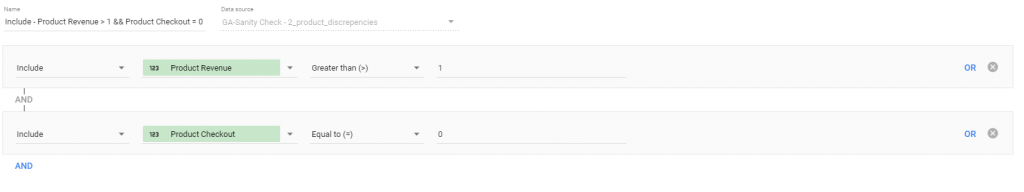
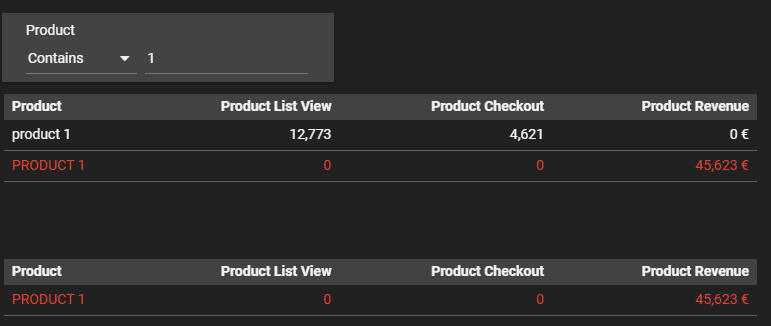
The filter of the report is simple, in the bottom table we want to identify products purchased but not identified in the checkout or other ecommerce interactions. The top table and the filtering command is used to find a product among all the (unfiltered) products and understand what the inconsistency factor was.
Thanks!